توضیحات
ارسال کتاب های زبان اصلی در بازه زمانی 8 الی 12 روز کاری انجام خواهد شد.
---------------------------------------------------------------------------------------------------
https://www.amazon.com/Data-Points-Visualization-Means-Something/dp/111846219X
==========================================================
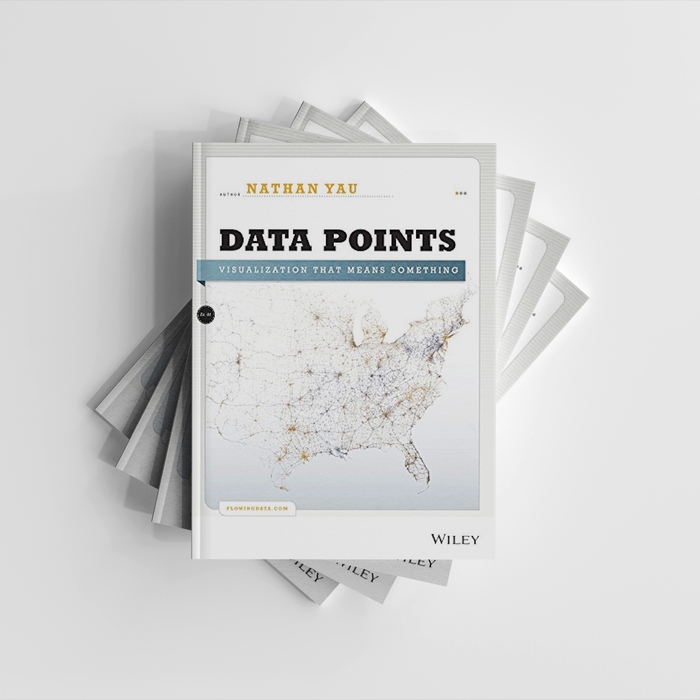
Data Points: Visualization That Means Something
by Nathan Yau(Author)
Whether it’s statistical charts, geographic maps, or the snappy graphical statistics you see on your favorite news sites, the art of data graphics or visualization is fast becoming a movement of its own. In Data Points: Visualization That Means Something, author Nathan Yau presents an intriguing complement to his bestseller Visualize This, this time focusing on the graphics side of data analysis. Using examples from art, design, business, statistics, cartography, and online media, he explores both standard-and not so standard-concepts and ideas about illustrating data.
Shares intriguing ideas from Nathan Yau, author of Visualize This and creator of flowingdata.com, with over 66,000 subscribers
Focuses on visualization, data graphics that help viewers see trends and patterns they might not otherwise see in a table
Includes examples from the author’s own illustrations, as well as from professionals in statistics, art, design, business, computer science, cartography, and more
Examines standard rules across all visualization applications, then explores when and where you can break those rules
Create visualizations that register at all levels, with Data Points: Visualization That Means Something.
To create effective data visualizations, you must be part statistician, part designer, and part storyteller. In his bestselling book Visualize This, Nathan Yau introduced you to the tools and programming techniques for visualization. Now, in Data Points, he explores the thinking process that helps you create original, meaningful visualizations that your audience will both understand and remember. Here’s how to make your data mean something.
Discover what data is and what you can learn from it
Learn how to explore your data, find the story, and bring it to life
Understand visualization as a medium that lets you present and express meaning in data
Tap into your creative side and determine the most effective way to tell your story


 افزودن به سبد خرید