توضیحات
ارسال کتاب های زبان اصلی در بازه ۸ الی ۱۲ روزه انجام میشود.
------------------------------------------------------------------------------------------
https://www.amazon.com/Interactive-Data-Visualization-Python-compelling/dp/۱۸۰۰۲۰۰۹۴۳
===========================================================================
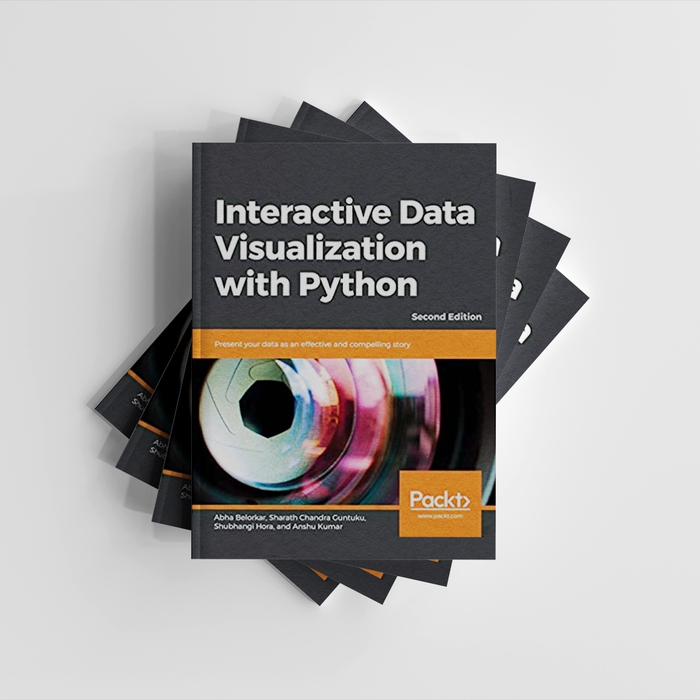
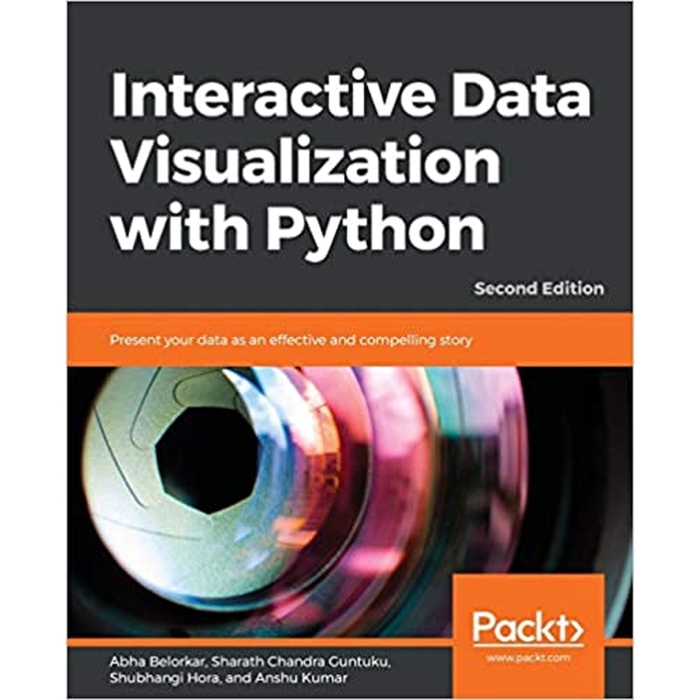
Interactive Data Visualization with Python, ۲nd Edition
Interactive Data Visualization with Python: Present your data as an effective and compelling story, ۲nd Edition
by Abha Belorkar (Author), Sharath Chandra Guntuku (Author), Shubhangi Hora (Author), Anshu Kumar (Author)
Create your own clear and impactful interactive data visualizations with the powerful data visualization libraries of Python
Key Features
Study and use Python interactive libraries, such as Bokeh and Plotly
Explore different visualization principles and understand when to use which one
Create interactive data visualizations with real-world data
Book Description
With so much data being continuously generated, developers, who can present data as impactful and interesting visualizations, are always in demand. Interactive Data Visualization with Python sharpens your data exploration skills, tells you everything there is to know about interactive data visualization in Python.
You’ll begin by learning how to draw various plots with Matplotlib and Seaborn, the non-interactive data visualization libraries. You’ll study different types of visualizations, compare them, and find out how to select a particular type of visualization to suit your requirements. After you get a hang of the various non-interactive visualization libraries, you’ll learn the principles of intuitive and persuasive data visualization, and use Bokeh and Plotly to transform your visuals into strong stories. You’ll also gain insight into how interactive data and model visualization can optimize the performance of a regression model.
By the end of the course, you’ll have a new skill set that’ll make you the go-to person for transforming data visualizations into engaging and interesting stories.
What you will learn
Explore and apply different interactive data visualization techniques
Manipulate plotting parameters and styles to create appealing plots
Customize data visualization for different audiences
Design data visualizations using interactive libraries





 افزودن به سبد خرید
